Yesterday we ran a complete workflow on toolik_weather.csv. Most of our analysis used a single column: Daily_AirTemp_Mean_C. However, the same file also holds precipitation, wind speed, radiation, and a set of flag columns that we never looked at.
Today you will write a data biography of the entire file.
What is a data biography?
A data biography is a short written account of a dataset: where it came from, what it covers, what condition it’s in, and what a reader needs to know before trusting anything computed from it. Working data scientists write them all the time, usually in the first few cells of a notebook. These notes provide context for a dataset and help avoid common problems when using a new or unfamiliar file.
By the time you leave today, your notebook should hold a biography of the Toolik weather data, written as markdown, with code cells showing the evidence for every claim you make.
Every statement in your biography must be backed by a cell that produced it. Not “the record covers about thirty years,” but the first year and the last year, exactly as you found them, with the cell that produced them sitting right above the sentence.
Setup
Create a new notebook named
EOD_Day2_Data_Biography.ipynb.Add a title cell:
# Day 2 EOD: A Data Biography of Toolik Field Station Weather

Date: 09/01/2026- Import pandas and read the data:
The file is at:
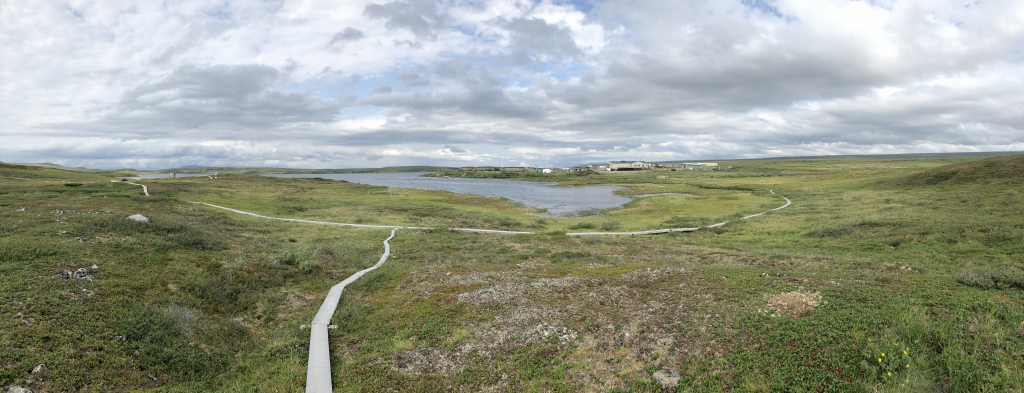
https://eds-217-essential-python.github.io/data/toolik_weather.csvToolik Field Station sits on the North Slope of Alaska, above the Arctic Circle, and is part of the Arctic Long Term Ecological Research (LTER) network. The station has been recording daily weather since the late 1980s. Keep the location in mind while you work, because some of the numbers you find should look reasonable for an Arctic site, and some of them should look suspicious!
Part 1: Vital statistics
Answer each question below with code, then write the answer out in a markdown cell underneath the cell that produced it.
- How many rows and how many columns does the dataset have?
- What are the column names? Get them as a Python list.
- What is the data type of each column?
- Yesterday’s practice told you this record runs from June 1988 to December 2018. Do not take that on trust. Use
.min()and.max()on theDatecolumn to find the exact first and last day and report those in a new cell.
Look closely at the Date column’s data type. Does it match what you’d expect a date to be? Say what pandas has actually stored there. You don’t need to fix it today, and we’ll handle dates properly on Day 6.
Part 2: The health check
- Run
.info(). How many columns have fewer non-null values than there are rows? - Use
.isnull().sum()to count missing values per column. Which three columns are the emptiest? - One of the flag columns is empty in all but a very small number of rows. Which one, and how many values does it actually have?
A column that is 99% empty is not necessarily broken. Think about what a “flag” column is for in an environmental dataset, and write a sentence explaining why it might be mostly empty by design.
Part 3: What varies, and what doesn’t
- Use
.value_counts()onLTER_Siteand onStation. What does each column tell you? - Use
.value_counts()onFlag_Daily_AirTemp_Mean_C. What values appear, and what do you think they mean? - Use
.value_counts()on theYearcolumn and look at both ends of the result, with.head()and then with.tail(). Do all years have the same number of observations? What would explain a year with fewer?
Part 4: The numbers
- What is the mean daily air temperature across the whole record? The minimum? The maximum?
- Are the mean, the minimum and the maximum plausible for a site above the Arctic Circle? Say why or why not.
- Pick one other numeric column and report its range. Does anything about it look wrong?
.describe() will average anything you point it at. Before you report a mean, satisfy yourself that the column holds one kind of thing, measured one way.
Part 5: A tidier table
- Build a list of the five columns you’d keep if you had to hand this dataset to a colleague who only cared about temperature. Use it to make a smaller DataFrame.
- Build a dictionary that renames at least two of those columns to something shorter and clearer. Apply it with
.rename(columns=...)and confirm the new names.
Part 6: Write the biography
In a single markdown cell, write 200 to 300 words covering:
- What this dataset is. Source, station, what is measured, at what frequency.
- Coverage. How many rows, what time span, how many variables.
- Condition. What’s missing and where. Which columns you would and would not trust.
- Cautions. Two specific things a person using this data should know before computing anything from it.
- Fitness for purpose. Could you use this dataset to describe how Arctic summer temperatures have changed over the record? Say yes or no, and say what you would want to check first.
Write it in complete sentences, for a colleague who has never opened the file and is about to use it for something.
If you’d like to check several columns at once rather than one at a time, you can loop over a list. We worked through loops in this afternoon’s live-coding session, so here is the whole pattern again, ready to paste. Just change the list and the print statement based on the information you’re looking for.
for column_name in ['Daily_AirTemp_Mean_C', 'Daily_Precip_Total_mm']:
    print(column_name, toolik[column_name].isnull().sum())
The loop is optional! Everything above can be done one column at a time.
Wrap-up
Before you close your notebook, check that:
- every factual claim in your biography has a code cell above it that produced the evidence
- your notebook reads top to bottom as a document, not as a pile of cells
- you have used at least one list and at least one dictionary
- you noticed at least one thing about this dataset that would have caused a problem if you hadn’t looked
A mostly empty column or a mismatched unit takes a minute to write down now, and an afternoon to unpick from a finished analysis, so the last check is worth a moment before you close the notebook.
If you get stuck, write down what you tried and then grab Cella or Kelly, who are both in the room until the end of the day. Asking early is always better than spending the rest of the session stuck on one cell!