End Activity Session (Day 1)
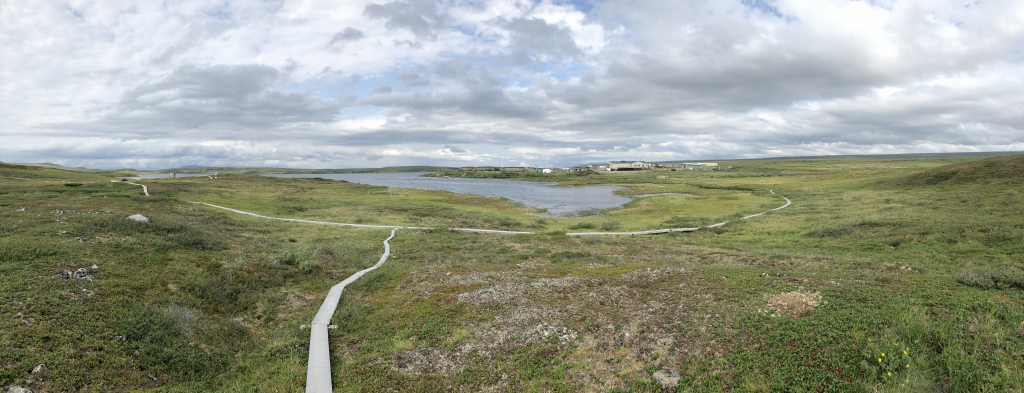
The boardwalk at Toolik Field Station, Alaska. Arcus
This afternoon we ran a complete data science workflow together, in Parts 1 and 2, on 11,171 days of Arctic weather from Toolik Lake, Alaska. Before you leave today, you will build that same workflow again in a notebook of your own, and then make one change to it in each of three short tasks to see what happens.
Don’t panic 🚀
You are not expected to understand every line today! You have already used every tool on this page once this afternoon, though only at a shallow level, and over the next six days we will cover each one properly. If a cell throws an error and you cannot work out why, grab Cella or Kelly and show them what you saw.
The data
We are using the same Arctic weather data from the Arctic LTER station at Toolik Lake, Alaska: one row per day, from June 1988 to December 2018. The file lives in our course repository, so you can load it straight from its URL.
When you’ll learn these skills
Every tool in this workflow gets taught properly later in the course, across Days 2 through 7, at one or two workflow steps a day. We use some of them this afternoon and meet the rest as the course goes on:
| The tool | When you’ll learn it | Workflow step |
|---|---|---|
pd.read_csv(), .head(), .info() |
Day 2 | Import + Explore |
df[df['col'] > value], .sort_values() |
Day 3 | Filter + Sort |
.dropna(), new columns |
Day 4 | Clean + Transform |
df.groupby(...)['col'].mean() |
Day 5 | Group + Aggregate |
pd.merge(), pivot_table() |
Day 6 | Join + Reshape + Dates |
plt.plot(), plt.bar() |
Day 7 | Visualize |
.to_csv() |
Day 7 | Visualize (saving counts as part of it) |
Setup
Set up your notebook with the same four steps we used in today’s sessions.
Create the file. In the Explorer, hover over the EDS217 heading and click New File…, then type the name in full, extension included:
EOD_Day1_Workflow.ipynbCheck the kernel. The Kernel Selector in the notebook’s action bar should read Python 3.11.15 (Conda: eds217).
Add a title cell.
# Day 1 EOD: Rerun the Workflow

Date: 08/31/2026- Save with
Ctrl + S(Cmd + Son macOS), and keep saving as you go.
Then work through the rest of this page in your new notebook. Copy each code cell, run it, then write a short markdown note under it saying what you saw.
Rebuild the workflow
Rebuild the analysis from this afternoon’s sessions. Copy and run each cell.
1. Import and load
Copy and run this code:
import pandas as pd
import matplotlib.pyplot as plt

url = "https://eds-217-essential-python.github.io/data/toolik_weather.csv"
df = pd.read_csv(url)
R vs Python: loading data
In R you would write df <- read.csv(url). Python’s pd.read_csv(url) does the same job, reading a CSV straight from a URL into a DataFrame.
2. Look at the data
Copy and run this code:
df.head()
df.isnull().sum()
The df.isnull().sum() line is the health check you met this afternoon. It counts missing values in each column. Daily_AirTemp_Mean_C has none, so the temperature analysis below needs no cleaning.
3. Monthly average temperature
Copy and run this code:
monthly = df.groupby('Month')
monthly_means = monthly['Daily_AirTemp_Mean_C'].mean()
monthly_means
R vs Python: grouping
In dplyr you would write df %>% group_by(Month) %>% summarize(mean(...)), and grouping in pandas does the same job. The two-step form df.groupby('Month') then ['col'].mean() splits the rows into monthly groups and averages one column within each.
4. Plot it
Copy and run this code:
plt.plot(monthly_means)
plt.title("Toolik Monthly Temperatures")
plt.xlabel("Month")
plt.ylabel("Temperature (°C)")
plt.show()
R vs Python: plotting
In R you might draw this with ggplot(...) + geom_line(). Here plt.plot(series) takes your twelve monthly values and draws them in order, and the label lines set the title and axes.
5. Export the summary
Your twelve monthly means only exist inside this notebook, and they are gone the moment the kernel restarts. Save them to a file, the way we did at the end of Part 2.
Copy and run this code:
monthly_means.to_csv("monthly_means.csv", header=True, float_format="%.2f")Open the Explorer in Positron and you should see monthly_means.csv next to your notebook. float_format="%.2f" writes every number with two decimals, which is the same rounding you print with :.2f in the tasks below.
You should now have df, monthly, and monthly_means in your notebook, which is where we ended up together this afternoon. Each of the three tasks below makes one change to the workflow you have just rebuilt.
🔁 Task 1: monthly means for a different variable
The rebuild averaged Daily_AirTemp_Mean_C. Keep the same grouping and average a different column instead.
What you wrote in the rebuild:
monthly_means = monthly['Daily_AirTemp_Mean_C'].mean()Your change: swap the column for one from this menu, and store the result in a new variable, because Task 3 still needs your original monthly_means:
Daily_Precip_Total_mm(daily precipitation)Daily_windsp_mean_msec(daily mean wind speed)Daily_globalrad_total_jcm2(daily global radiation), which the station only records reliably from May to September. Pick a summer month if you choose this one.
For example, monthly_precip = monthly['Daily_Precip_Total_mm'].mean(). The new line reads monthly, which was built from df, so it leaves both df and your monthly_means unchanged.
✍️ Required: say it in a sentence
Read one month’s value from your new result and report it in an f-string. A mean usually comes out with a long tail of decimals, so add :.2f inside the braces to round it to two:
june_precip = 1.5372   # June's value, read from your output
print(f"At Toolik, June's average daily precipitation was {june_precip:.2f} mm.")
The :.2f changes only what is printed. june_precip still holds every decimal it had.
🔁 Task 2: yearly means
The rebuild grouped by Month. Now change the grouping key to Year to see the year-by-year trend across the whole record.
What you wrote in the rebuild:
monthly = df.groupby('Month')
monthly_means = monthly['Daily_AirTemp_Mean_C'].mean()
Your change: group by a different key. Build a new grouping and average the same temperature column into new variables:
by_year = df.groupby('Year')
yearly_means = by_year['Daily_AirTemp_Mean_C'].mean()
yearly_means
The new grouping reads df without changing it, and it leaves monthly and monthly_means alone.
✍️ Required: say it in a sentence
Read one year’s value from yearly_means and report it in an f-string. For example, after reading the value for the year 2000:
temp_2000 = -8.9675    # the year 2000 value, read from your output
print(f"In 2000, Toolik's average temperature was {temp_2000:.2f} degrees Celsius.")
🔁 Task 3: a labeled bar chart
Draw the monthly temperatures as a bar chart with month-name labels, then change the title.
Copy and run this code:
months = ['Jan', 'Feb', 'Mar', 'Apr', 'May', 'Jun', 'Jul', 'Aug', 'Sep', 'Oct', 'Nov', 'Dec']
plt.bar(months, monthly_means)
plt.title("Toolik Monthly Temperatures")
plt.xlabel("Month")
plt.ylabel("Temperature (°C)")
plt.show()
Note
The month names line up with the bars only because monthly_means is in calendar order, from month 1 to month 12. plt.bar pairs the first name with the first bar, the second name with the second bar, and so on down the list. If you ever re-sorted monthly_means, for example by value, the names would no longer match the bars, so keep your data in month order whenever you use a fixed label list like this one.
Your change: give the chart a new title. Pick one and re-run:
plt.title("Average Temperature by Month at Toolik")plt.title("Arctic Seasonality, Toolik Lake")plt.title("Monthly Mean Air Temperature, 1988 to 2018")
✍️ Required: say it in a sentence
Find the coldest month on your chart, then take its value from the monthly_means you printed in step 3 and report it in an f-string. For example, for January:
coldest = -22.8890    # January's value, from your step 3 output
print(f"Toolik's coldest month averages about {coldest:.2f} degrees Celsius.")
Wrap-up
Nice work! You have now rerun a complete data science workflow, from a file on the web to a chart and a saved summary, and changed three things in it (hopefully!): the variable you averaged, the grouping key, and a chart label. Each time, you read a number off your own output and reported it in a sentence of your own with an f-string. The workflow you just reran is the whole course in miniature, and starting Day 2 we will cover how each step works, at one or two steps a day, until Days 8 and 9, when you and your team run the whole thing on a dataset of your own.