“Python is powerful… and fast; plays well with others; runs everywhere; is friendly & easy to learn; is Open.”
What is Python?
Python is a general-purpose, object-oriented programming language that emphasizes code readability through its generous use of white space. Released in 1989, Python is easy to learn and a favorite of programmers and developers.
High-level languages
(Python, C, C++, Java, Javascript, R, Pascal) - Take less time to write - Shorter and easier to read - Portable, meaning that they can run on different kinds of computers with few or no modifications.
The engine that translates and runs Python is called the Python Interpreter
""" Entering code into this notebook cell and pressing [SHIFT-ENTER] will cause the python interpreter to execute the code"""
' \nEntering code into this notebook cell \nand pressing [SHIFT-ENTER] will cause the \npython interpreter to execute the code\n'
"""Alternatively, you can run a any python script file (.py file)so long as it contains validpython code."""!python hello_world.py
Hello world!
[from hello_world.py]
Natural vs. Formal Languages
Natural languages are the languages that people speak. They are not designed (although they are subjected to various degrees of “order”) and evolve naturally.
Formal languages are languages that are designed by people for specific applications. - Mathematical Notation \(E=mc^2\) - Chemical Notation: \(\text{H}_2\text{O}\)
Programming languages are formal languages that have been designed to express computations.
Parsing: The process of figuring out what the structure of a sentence or statement is (in a natural language you do this subconsciously).
Formal Languages have strict syntax for tokens and structure:
Mathematical syntax error: \(E=\$m🦆_2\) (bad tokens & bad structure)
Chemical syntax error: \(\text{G}_3\text{Z}\) (bad tokens, but structure is okay)
Differences between Natural and Formal languages
Ambiguity: Natural languages are full of ambiguity, which people parse using contextual clues. Formal languages are nearly or completely unambiguous; any statement has exactly one meaning, regardless of context.
Redundancy: In order to make up for ambiguity, natural languages employ lots of redundancy. Formal languages are less redundant and more concise.
Literalness: Formal languages mean exactly what they say. Natural languages employ idioms and metaphors.
The inherent differences between familiar natural languages and unfamiliar formal languages creates one of the greatest challenges in learning to code.
A continuum of formalism
poetry: Words are used for sound and meaning. Ambiguity is common and often deliberate.
prose: The literal meaning of words is important, and the structure contributes meaning. Amenable to analysis but still often ambiguous.
program: Meaning is unambiguous and literal, and can be understood entirely by analysis of the tokens and structure.
Strategies for parsing formal languages:
Formal languages are very dense, so it takes longer to read them.
Structure is very important, so it is usually not a good idea to read from top to bottom, left to right. Instead, learn to parse the program in your head, identifying the tokens and interpreting the structure.
Details matter. Little things like spelling errors and bad punctuation, which you can get away with in natural languages, will make a big difference in a formal language.
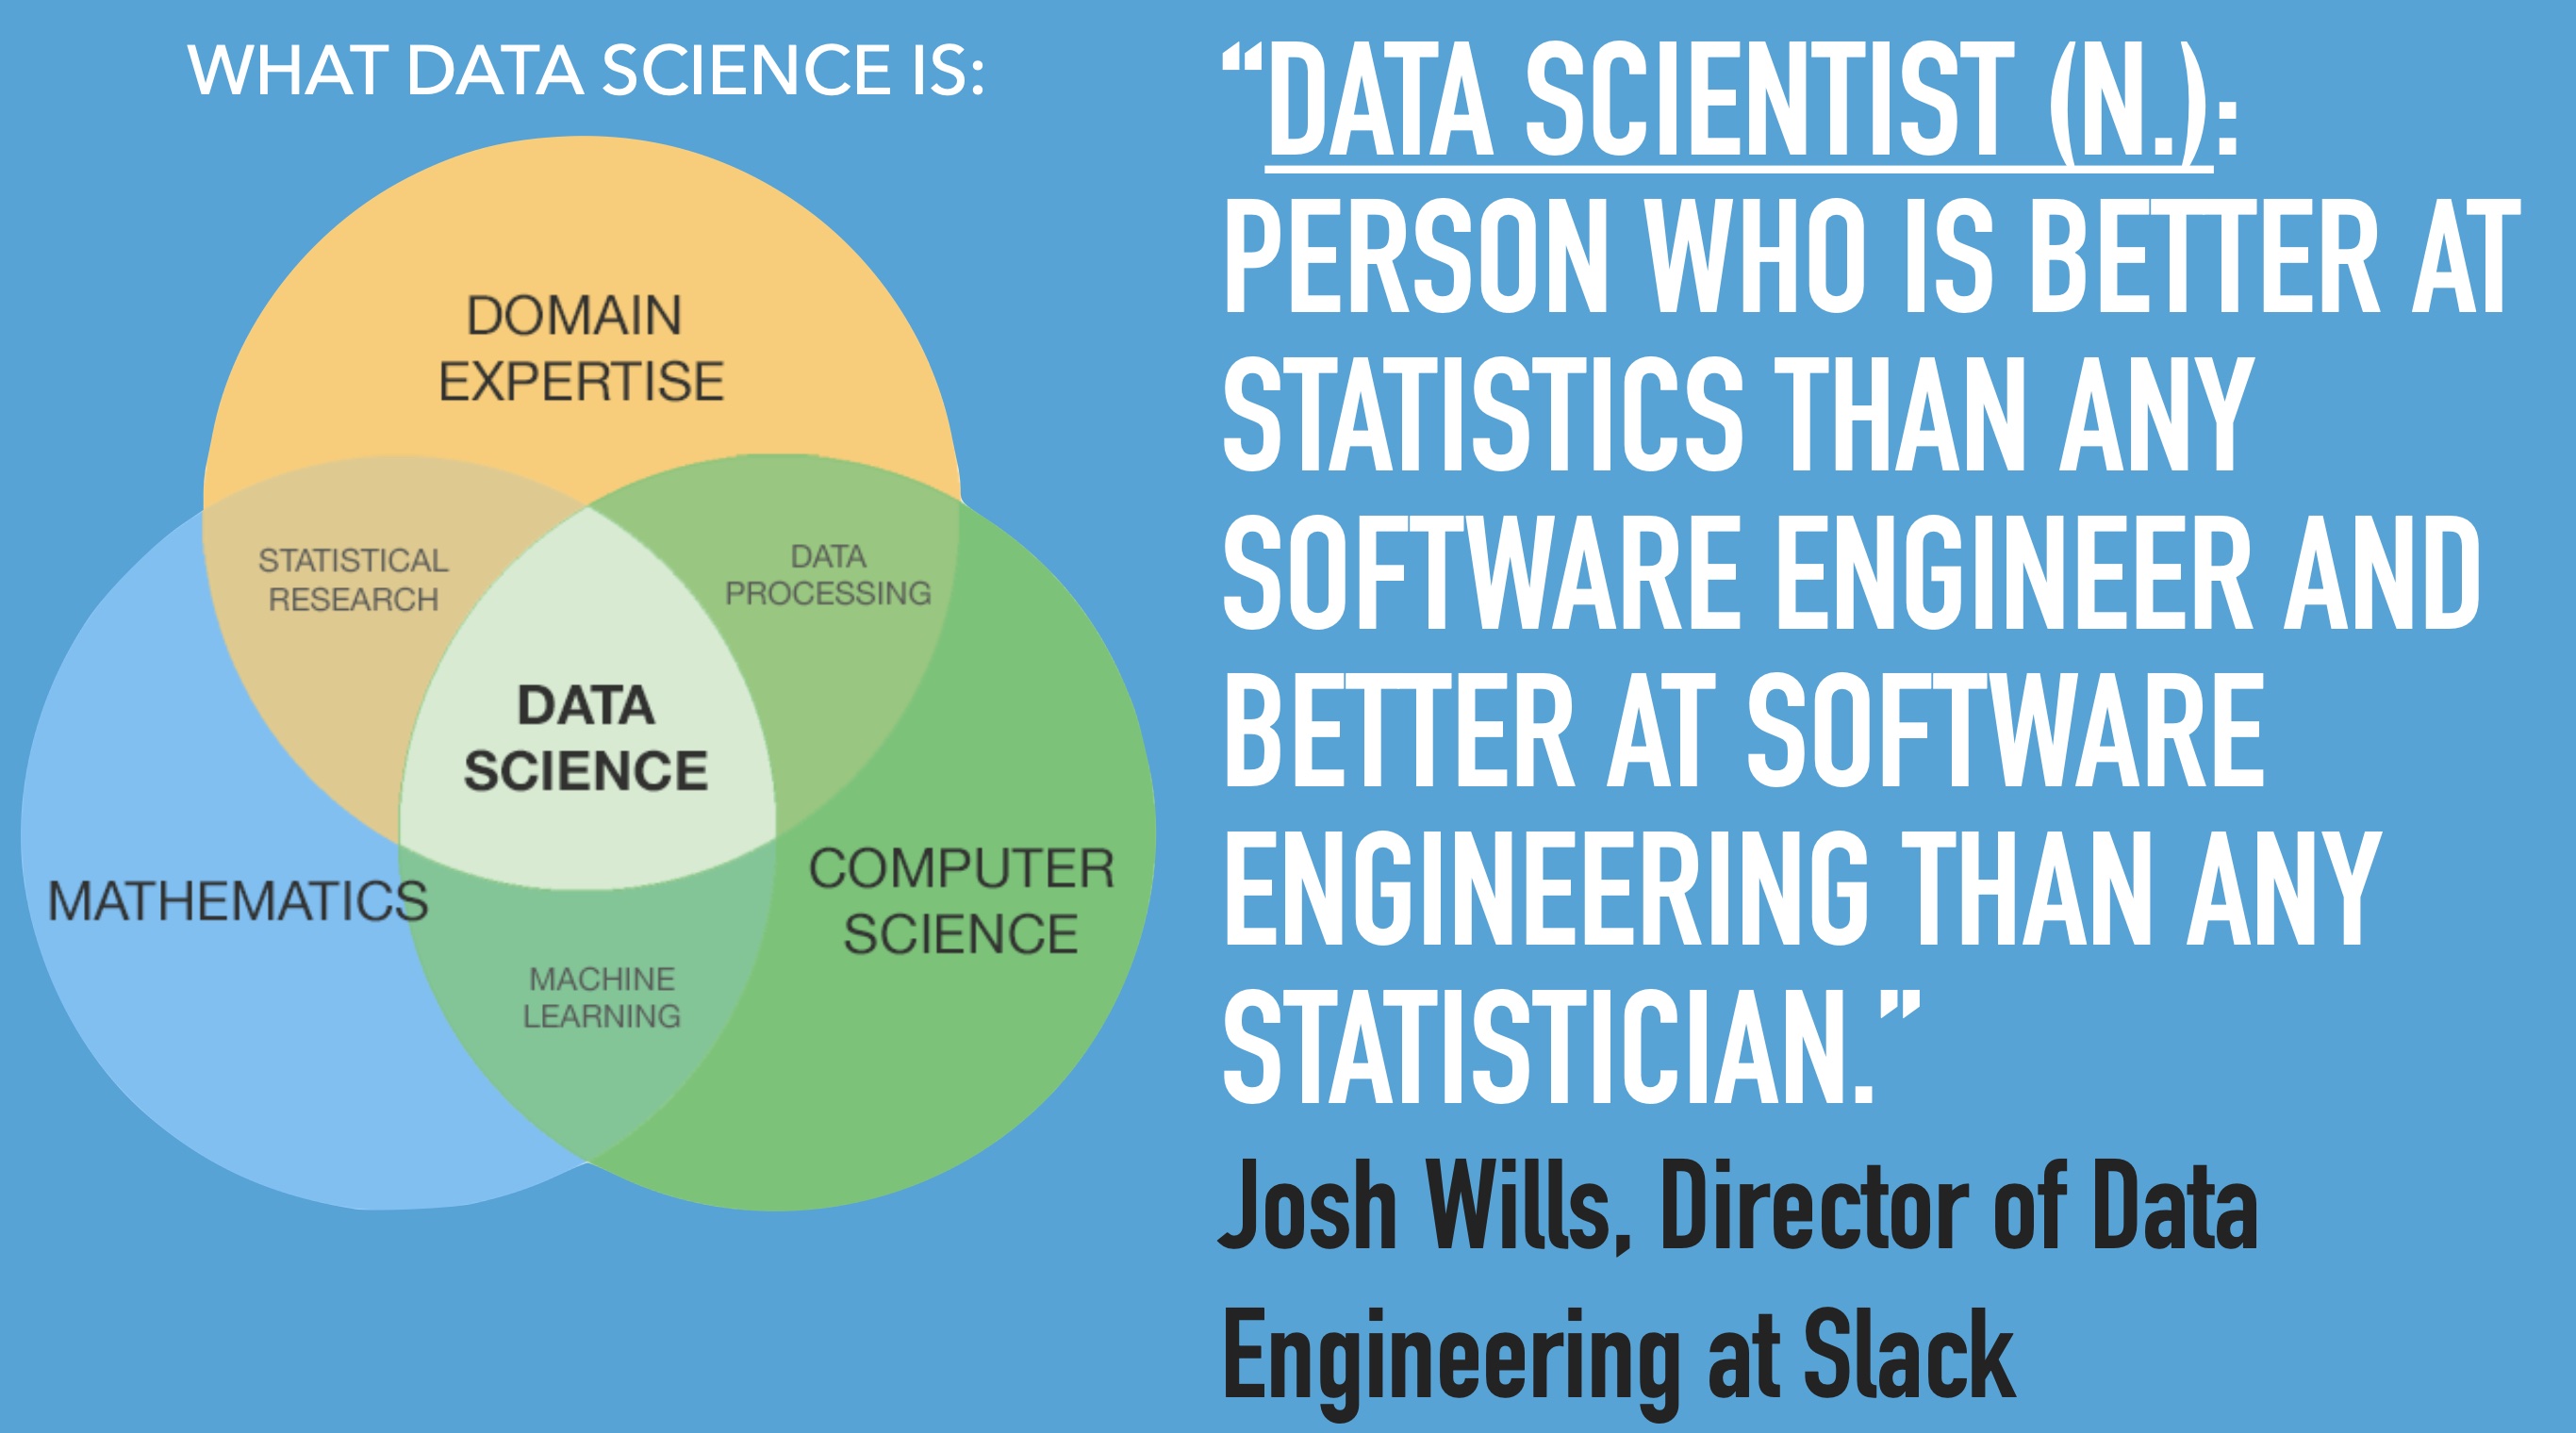
Python is a multi-purpose language with a readable syntax that’s easy to learn. Programmers use Python to delve into data analysis or use machine learning in scalable production environments.
R is built by statisticians and leans heavily into statistical models and specialized analytics. Data scientists use R for deep statistical analysis, supported by just a few lines of code and beautiful data visualizations.
In general, R is better for initial exploratory analyses, statistical analyses, and data visualization.
In general, Python is better for working with APIs, writing maintainable, production-ready code, working with a diverse array of data, and building machine learning or AI workflows.
Both languages can do anything. Most data science teams use both languages. (and others too.. Matlab, Javascript, Go, Fortran, etc…)
from IPython.lib.display import YouTubeVideoYouTubeVideo('GVvfNgszdU0')
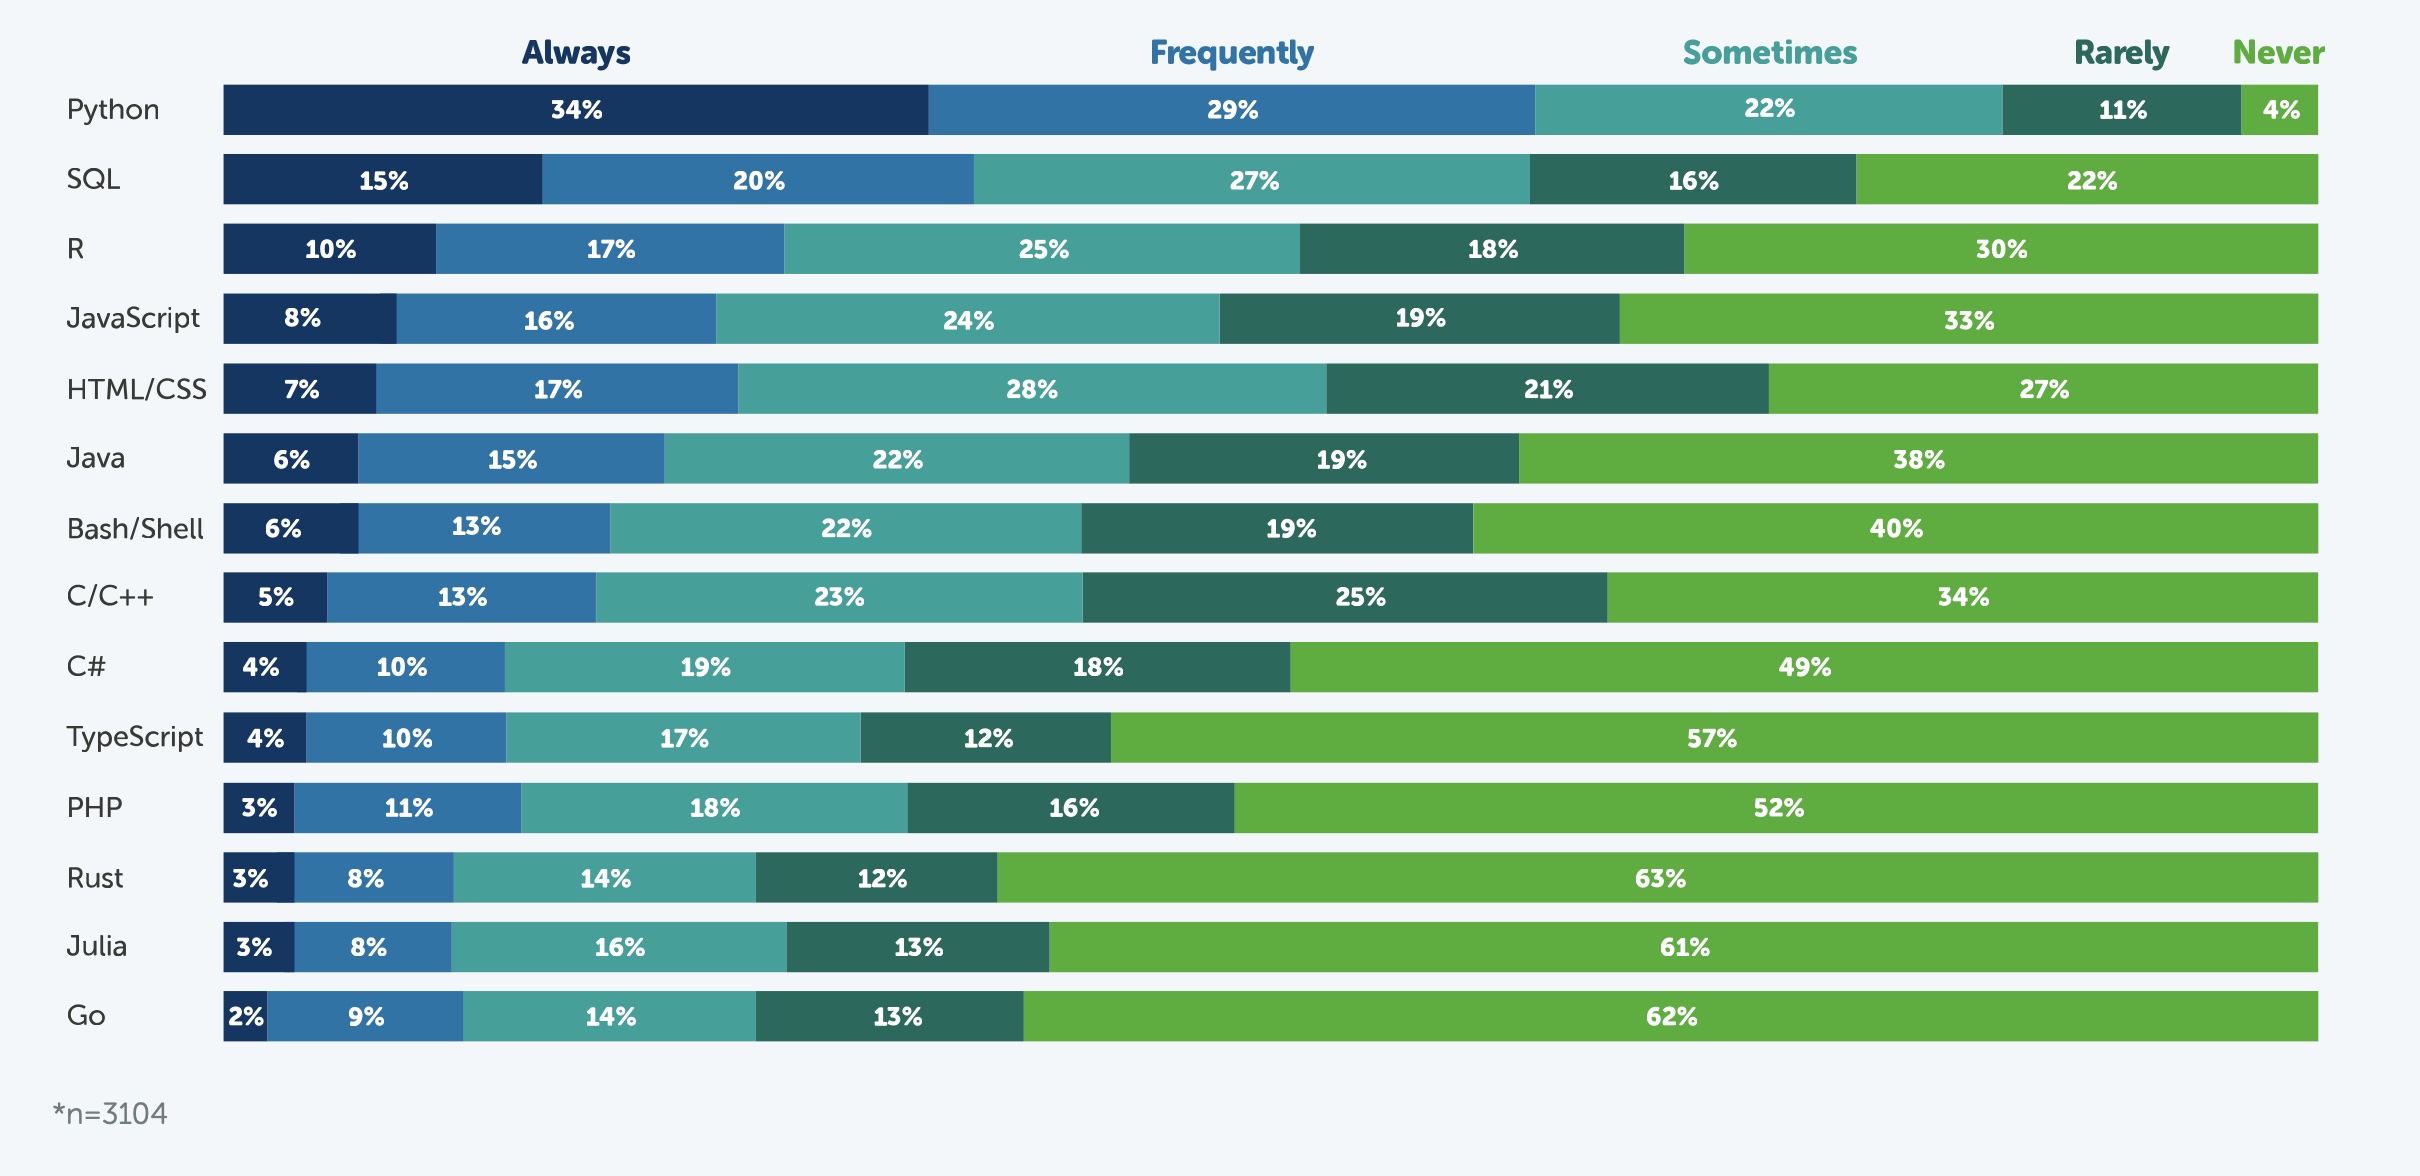
But, unfortunately, they changed the format of the responses concerning language use between 2022 and 2023. But we can take look at the 2022 data…
Let’s do some python data science!
# First, we need to gather our toolsimport pandas as pd # This is the most common data science package used in python!import matplotlib.pyplot as plt # This is the most widely-used plotting package.import requests # This package helps us make https requests import io # This package is good at handling input/output streams
# Here's the url for the 2022 data. It has a similar structure to the 2021 data, so we can compare them.url ="https://static.anaconda.cloud/content/Anaconda_2022_State_of_Data_Science_+Raw_Data.csv"response = requests.get(url)
# Read the response into a dataframe, using the io.StringIO function to feed the response.txt.# Also, skip the first three rowsdf = pd.read_csv(io.StringIO(response.text), skiprows=3)# Our very first dataframe!df.head()# Jupyter notebook cells only output the last value requested...
In which country is your primary residence?
Which of the following age groups best describes you?
What is the highest level of education you've achieved?
Gender: How do you identify? - Selected Choice
The organization I work for is best classified as a:
What is your primary role? - Selected Choice
For how many years have you been in your current role?
What position did you hold prior to this? - Selected Choice
How would you rate your job satisfaction in your current role?
What would cause you to leave your current employer for a new job? Please select the top option besides pay/benefits. - Selected Choice
...
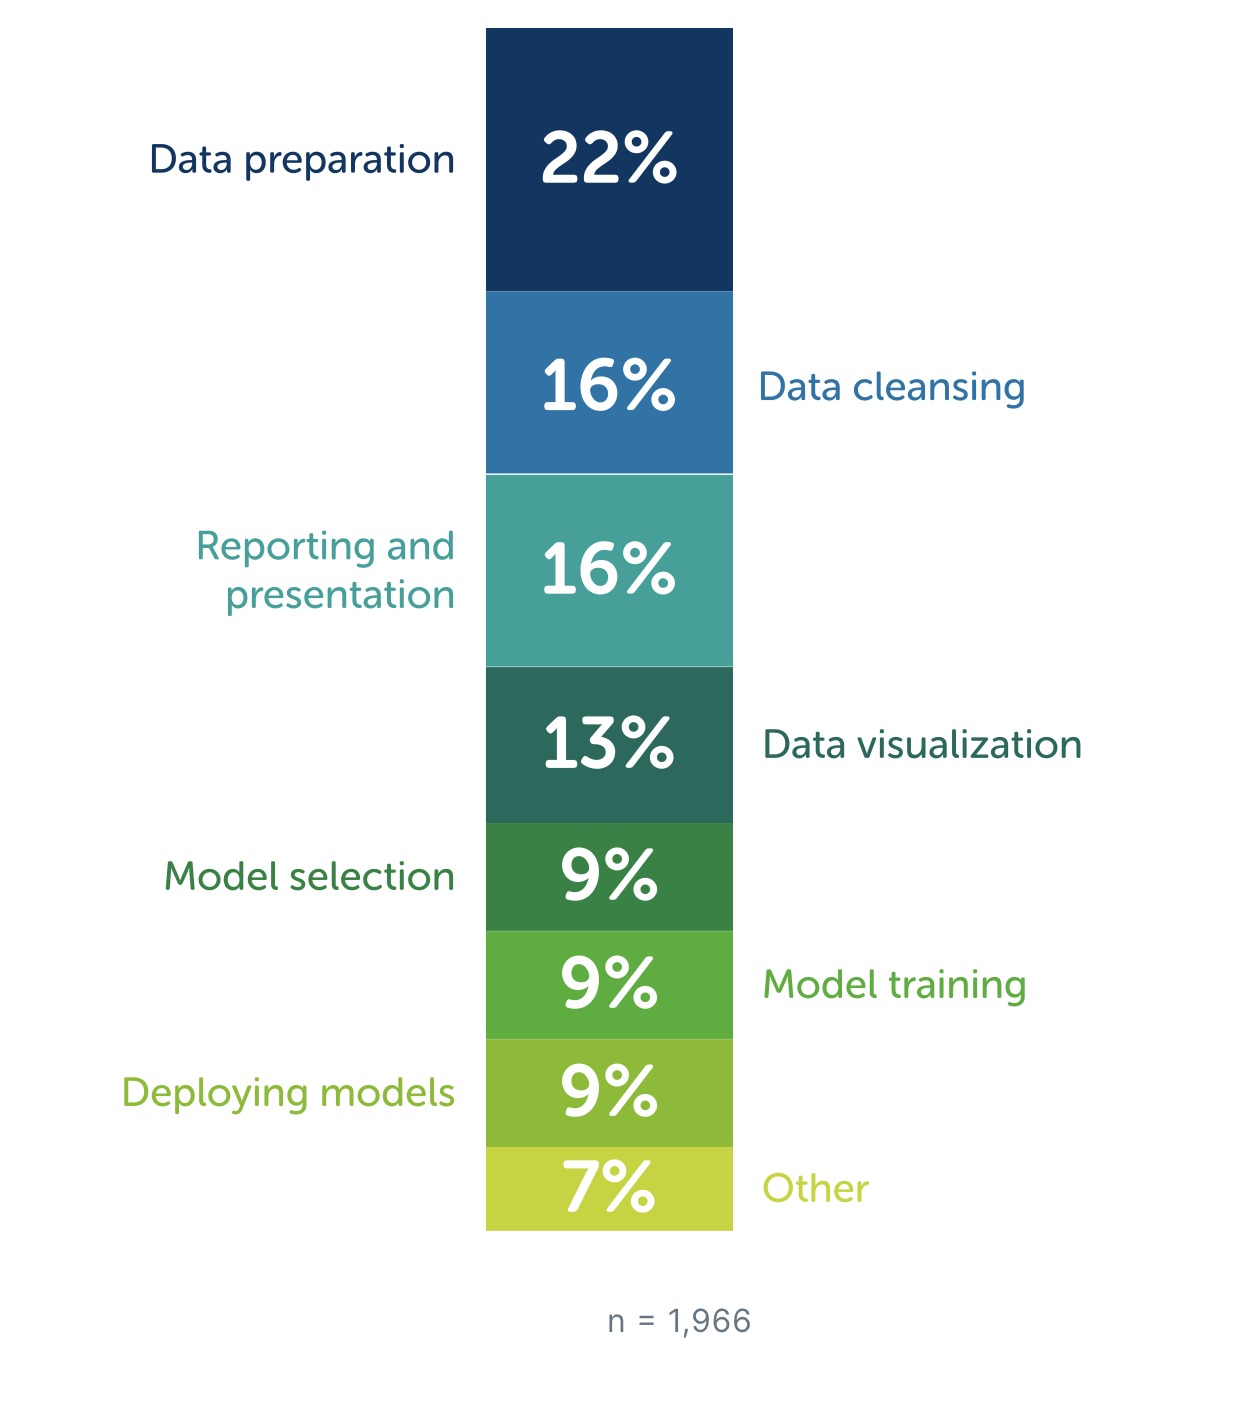
What should an AutoML tool do for data scientists? Please drag answers to rank from most important to least important. (1=most important) - Help choose the best model types to solve specific problems
What should an AutoML tool do for data scientists? Please drag answers to rank from most important to least important. (1=most important) - Speed up the ML pipeline by automating certain workflows (data cleaning, etc.)
What should an AutoML tool do for data scientists? Please drag answers to rank from most important to least important. (1=most important) - Tune the model once performance (such as accuracy, etc.) starts to degrade
What should an AutoML tool do for data scientists? Please drag answers to rank from most important to least important. (1=most important) - Other (please indicate)
What do you think is the biggest problem in the data science/AI/ML space today? - Selected Choice
What tools and resources do you feel are lacking for data scientists who want to learn and develop their skills? (Select all that apply). - Selected Choice
How do you typically learn about new tools and topics relevant to your role? (Select all that apply). - Selected Choice
What are you most hoping to see from the data science industry this year? - Selected Choice
What do you believe is the biggest challenge in the open-source community today? - Selected Choice
Have supply chain disruption problems, such as the ongoing chip shortage, impacted your access to computing resources?
0
United States
26-41
Doctoral degree
Male
Educational institution
Data Scientist
1-2 years
Data Scientist
Very satisfied
More flexibility with my work hours
...
4.0
2.0
5.0
6.0
A reduction in job opportunities caused by aut...
Hands-on projects,Mentorship opportunities
Reading technical books, blogs, newsletters, a...
Further innovation in the open-source data sci...
Undermanagement
No
1
United States
42-57
Doctoral degree
Male
Commercial (for-profit) entity
Product Manager
5-6 years
NaN
Very satisfied
More responsibility/opportunity for career adv...
...
2.0
5.0
4.0
6.0
Social impacts from bias in data and models
Tailored learning paths
Free video content (e.g. YouTube)
More specialized data science hardware
Public trust
Yes
2
India
18-25
Bachelor's degree
Female
Educational institution
Data Scientist
NaN
NaN
NaN
NaN
...
1.0
4.0
2.0
6.0
A reduction in job opportunities caused by aut...
Hands-on projects,Mentorship opportunities
Reading technical books, blogs, newsletters, a...
Further innovation in the open-source data sci...
Undermanagement
I'm not sure
3
United States
42-57
Bachelor's degree
Male
Commercial (for-profit) entity
Professor/Instructor/Researcher
10+ years
NaN
Moderately satisfied
More responsibility/opportunity for career adv...
...
1.0
5.0
4.0
6.0
Social impacts from bias in data and models
Hands-on projects
Reading technical books, blogs, newsletters, a...
New optimized models that allow for more compl...
Talent shortage
No
4
Singapore
18-25
High School or equivalent
Male
NaN
Student
NaN
NaN
NaN
NaN
...
4.0
2.0
3.0
6.0
Social impacts from bias in data and models
Community engagement and learning platforms,Ta...
Reading technical books, blogs, newsletters, a...
Further innovation in the open-source data sci...
Undermanagement
Yes
5 rows × 120 columns
# Jupyter notebook cells only output the last value... unless you use print commands!print(f'Number of survey responses: {len(df)}')print(f'Number of survey questions: {len(df.columns)}')
Number of survey responses: 3493
Number of survey questions: 120
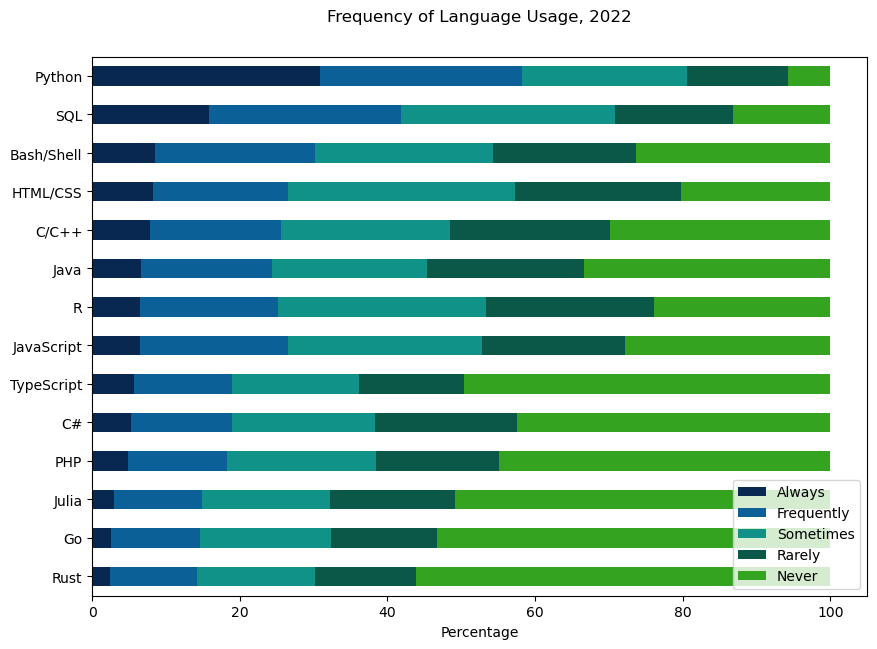
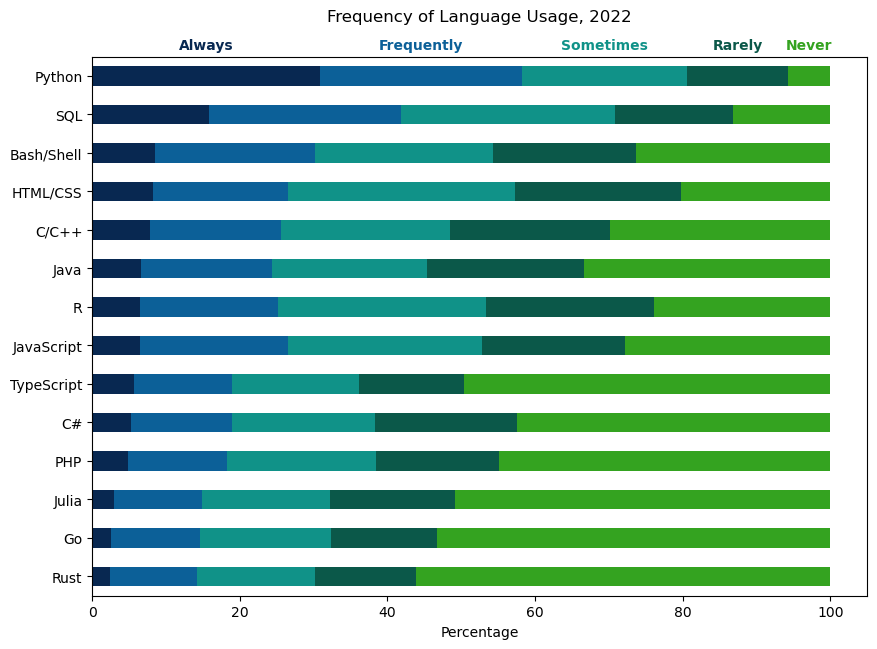
# 1. Filter the dataframe to only the questions about programming language usage, and filtered_df = df.filter(like='How often do you use the following languages?').copy() # Use copy to force python to make a new copy of the data, not just a reference to a subset.# 2. Rename the columns to just be the programming languages, without the question preamblefiltered_df.rename(columns=lambda x: x.split('-')[-1].strip() if'-'in x else x, inplace=True)print(filtered_df.columns)
# Calculate the percentage of each response for each languagepercentage_df = filtered_df.apply(lambda x: x.value_counts(normalize=True).fillna(0) *100).transpose()# Remove the last row, which is the "Other" categorypercentage_df = percentage_df[:-1]# Sort the DataFrame based on the 'Always' responsessorted_percentage_df = percentage_df.sort_values(by='Always', ascending=True)
# Let's get ready to plot the 2022 data...from IPython.display import display# We are going to use the display command to update our figure over multiple cells. # This usually isn't necessary, but it's helpful here to see how each set of commands updates the figure# Define the custom order for plottingorder = ['Always', 'Frequently', 'Sometimes', 'Rarely', 'Never']colors = {'Always': (8/255, 40/255, 81/255), # Replace R1, G1, B1 with the RGB values for 'Dark Blue''Frequently': (12/255, 96/255, 152/255), # Replace R2, G2, B2 with the RGB values for 'Light Ocean Blue''Sometimes': (16/255, 146/255, 136/255), # and so on...'Rarely': (11/255, 88/255, 73/255),'Never': (52/255, 163/255, 32/255)}
# Make the plotfig, ax = plt.subplots(figsize=(10, 7))sorted_percentage_df[order].plot(kind='barh', stacked=True, ax=ax, color=[colors[label] for label in order])ax.set_xlabel('Percentage')ax.set_title('Frequency of Language Usage, 2022',y=1.05)plt.show() # This command draws our figure.
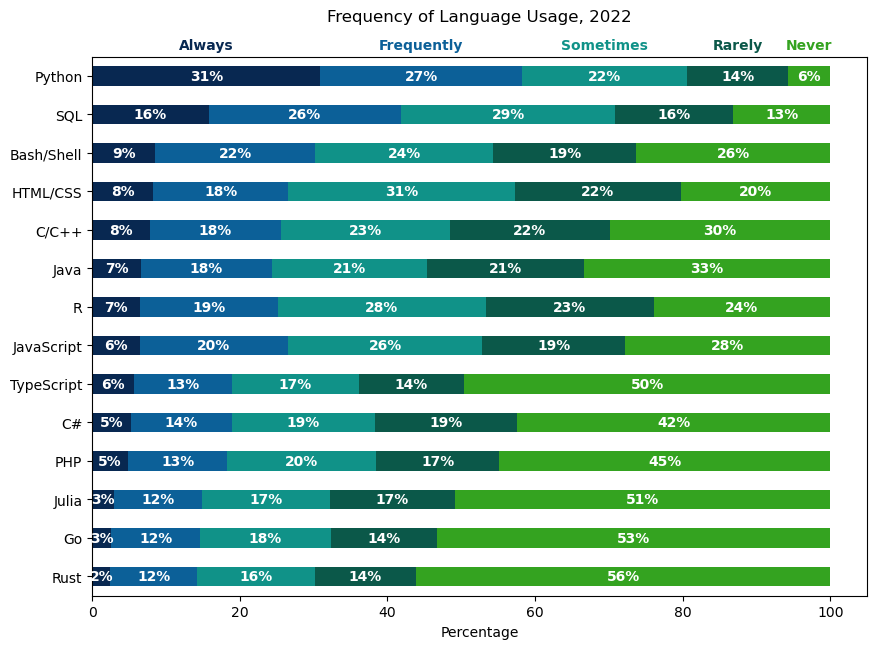
# Add labels across the top, like in the original graph# Get the patches for the top-most barnum_languages =len(sorted_percentage_df)patches = ax.patches[num_languages-1::num_languages]# Calculate the cumulative width of the patches for the top-most barcumulative_widths = [0] *len(order)widths = [patch.get_width() for patch in patches]for i, width inenumerate(widths): cumulative_widths[i] = width + (cumulative_widths[i-1] if i >0else0)
# Add text labels above the barsfor i, (width, label) inenumerate(zip(cumulative_widths, order)):# Get the color of the current bar segment# Calculate the position for the text label position = width - (patches[i].get_width() /2)# Add the text label to the plot# Adjust the y-coordinate for the text label y_position =len(sorted_percentage_df) -0.3# Adjust the 0.3 value as needed ax.text(position, y_position, label, ha='center', color=colors[label], fontweight='bold')# Remove the legendax.legend().set_visible(False)#plt.show()display(fig) # This command shows our updated figure (we can't re-use "plt.show()")
# Add percentage values inside each patchfor patch in ax.patches:# Get the width and height of the patch width, height = patch.get_width(), patch.get_height()# Calculate the position for the text label x = patch.get_x() + width /2 y = patch.get_y() + height /2# Get the percentage value for the current patch percentage ="{:.0f}%".format(width)# Add the text label to the plot ax.text(x, y, percentage, ha='center', va='center', color='white', fontweight='bold')display(fig) # Let's see those nice text labels!
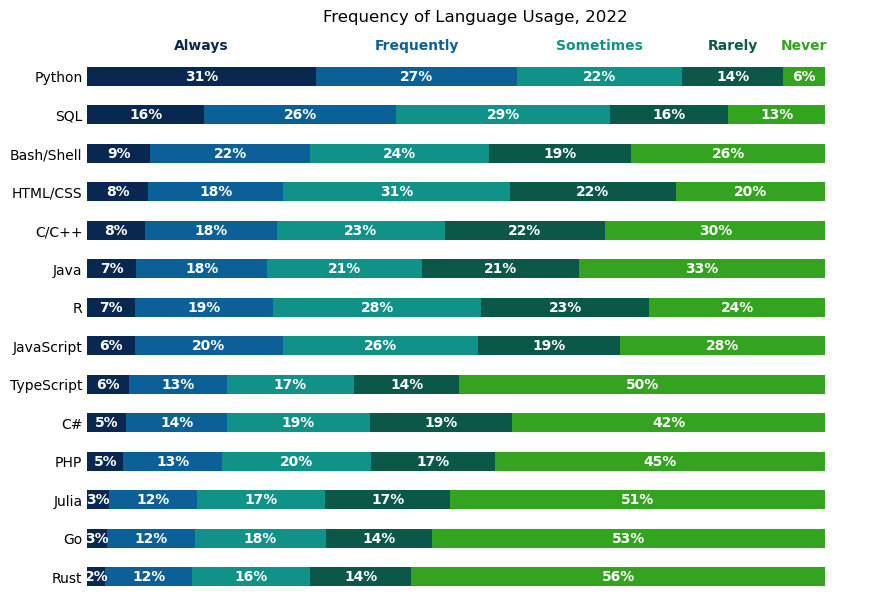
# Clean up the figure to remove spines and unecessary labels/ticks, etc..# Remove x-axis labelax.set_xlabel('')# Remove the spinesax.spines['top'].set_visible(False)ax.spines['right'].set_visible(False)ax.spines['bottom'].set_visible(False)ax.spines['left'].set_visible(False)# Remove the y-axis tick marksax.tick_params(axis='y', which='both', length=0)# Remove the x-axis tick marks and labelsax.tick_params(axis='x', which='both', bottom=False, top=False, labelbottom=False)display(fig) # Now 100% less visually cluttered!
By end of this course, you will have learned the essentials of the python programming language, the main python data science library pandas, and basics of making figures using libraries that work with pandas dataframes.
The next 9 days: Learn how to write code and get comfortable using Python.
Our class will excclusively use Jupyter notebooks running in JuypterLab on our MEDS server.
Eventually (later!) you can learn to manage python working environments using conda
You can also learn to write code in an IDE using VSCode. (You should! Later!)
You can also explore using .py files and other tools for developing your own functions and re-usable code.